
Home Bias in Investing: What Is It and How Could it Impact Your Investments
/Disclaimer: In this article I refer to data published in various studies undertaken by Vangaurd. I also refer to various Vanguard products. I am in no way endorsed by Vanguard, I simply think they offer effective investment products, at a low ongoing cost. Click here for a full disclaimer.
Investor home bias (a.k.a the equity home bias puzzle) is the tendency for investors to allocate a large portion of their investments domestically, rather than internationally.
Investors may justify their large domestic weighting in their portfolio. But how reasonable are these justifications and what are the potential ramifications? In this article I discuss the role of home bias, the risks, the international trends and some options if you’re looking to mitigate it.
Home Bias In 4 Developed Countries
The USA, UK, Canada and Australia
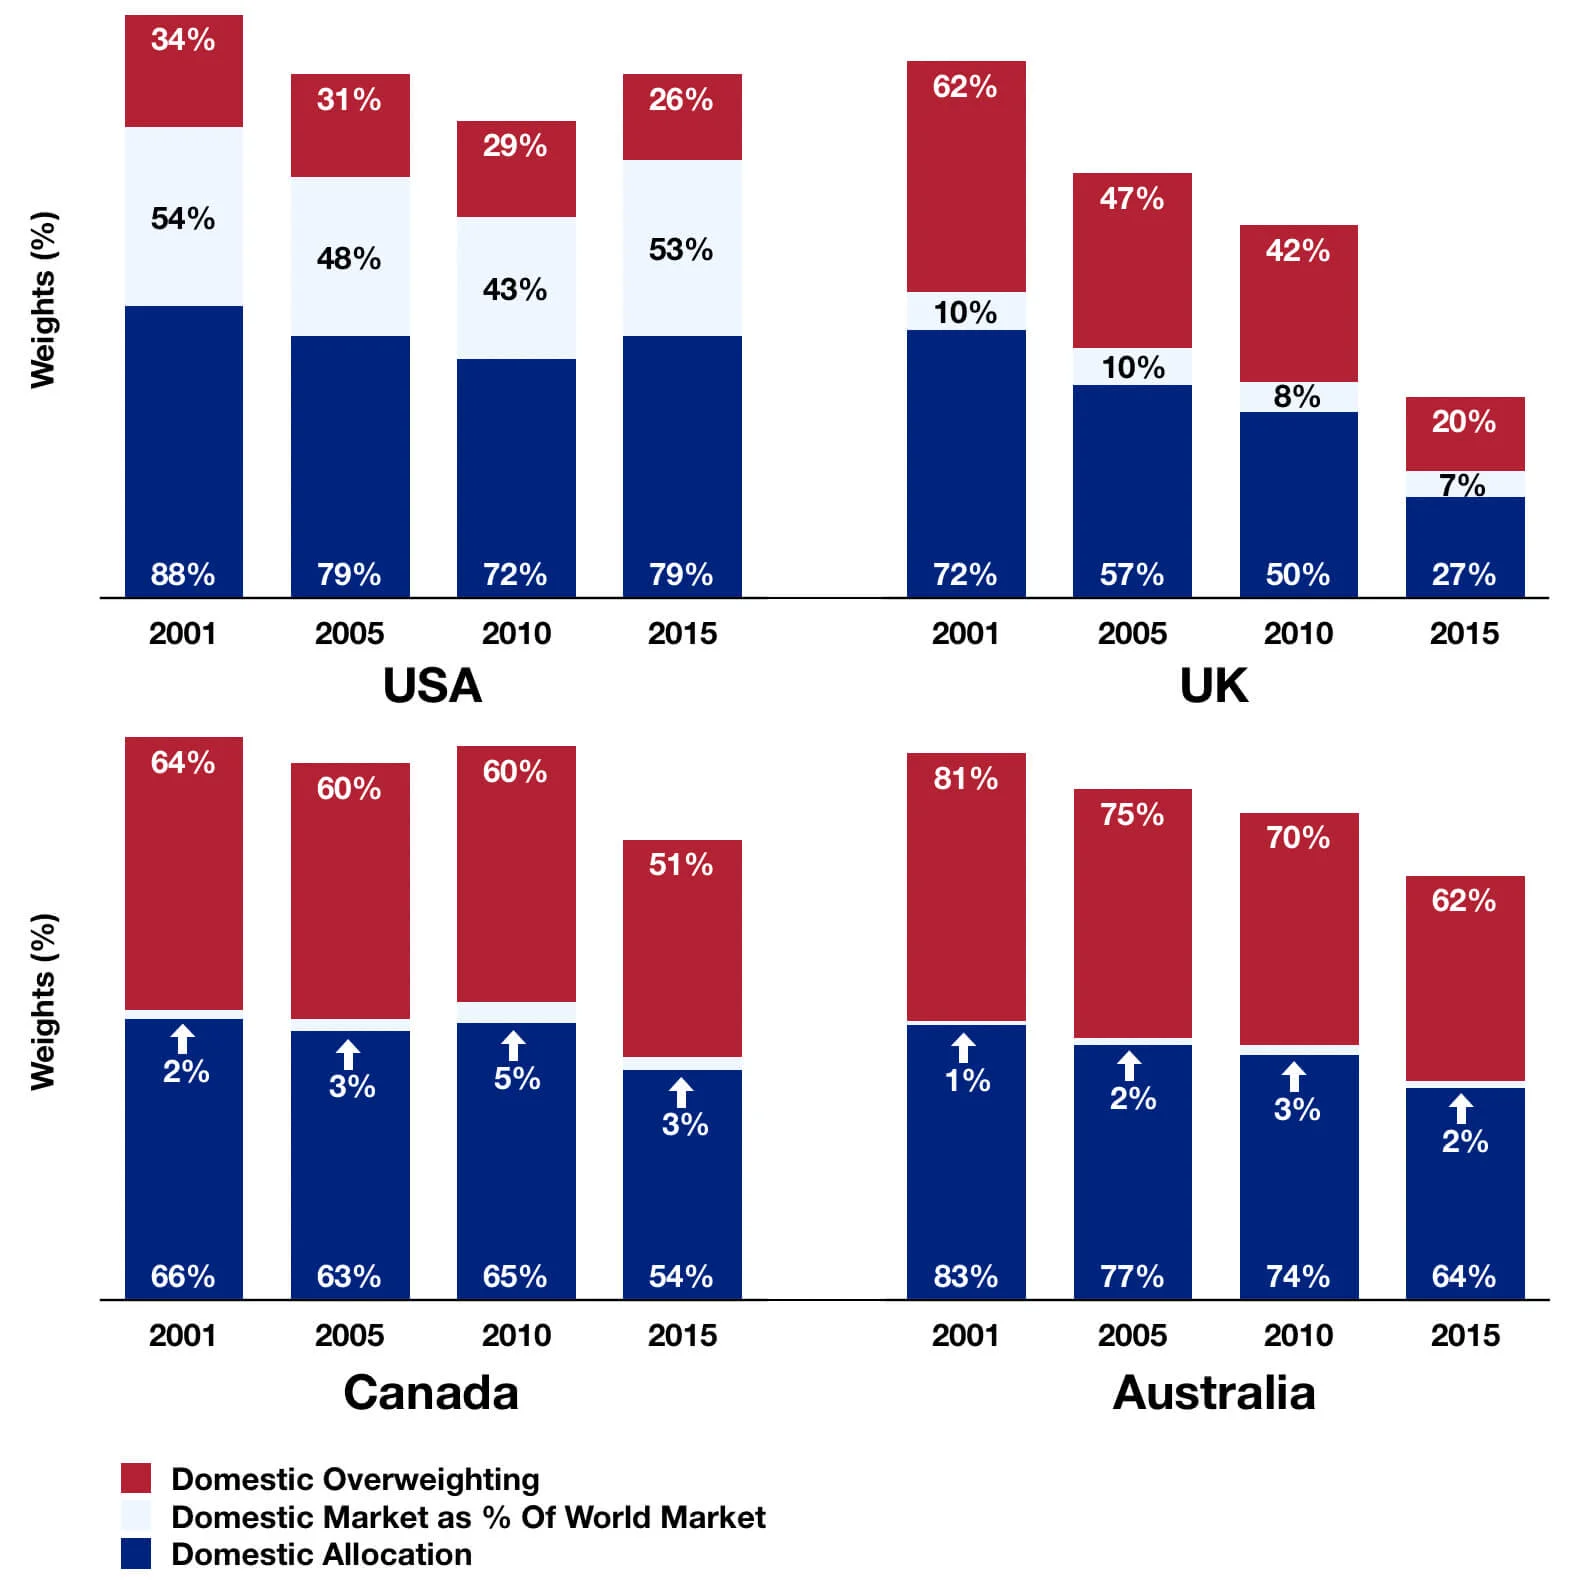
The chart below combines the results from 2 Vanguard studies which looked at investor home bias from 2001 to 2015 in 4 developed economies. The USA, the UK, Canada and Australia.
The dark blue bars represent the percentage that domestic investors allocate to domestic equities. The white bars represent what percentage that domestic market was of the world market at the time. The red bars then simply measure the difference between those two. Therefore, the red bars indicate how ‘overexposed’ investors are to their own country.
Home Bias Is Present
In all cases, home bias is present (red bars). But of course, some markets are larger than others. US-based investors, as a whole, allocated 79% of their investments to domestic stocks in 2015. The US market, however, is a large portion of the world (53% in 2015). The home bias rate was 26% in that case.
Compare that to Australian investors. Australia, in 2015, made up 2% of the global equity market. But Australian investors allocated 64% of their portfolios, as a whole, to Australian equities. Domestic overexposure, in this case, was 62%. So even though Americans allocated a larger percentage of their portfolios to their home country (79%), the home bias ‘overexposure’ was less.
Justifications For Home Bias
According to Vanguard, some of the reasons for home bias include:
Higher Domestic Expectations: Investors have higher expectations for the performance of their home market, compared to foreign markets.
The Familiarity Preference: Investors tend to be more knowledgable about their domestic market and they use this to justify a greater domestic allocation.
Domestic Companies Trade Internationally: Investors expect global diversification to be achieved by investing in domestic companies that operate internationally. This, despite historical evidence that the performance of these multinationals are still largely dependent on their domestic market.
Currency Risk: Fluctuations in exchange rates. Currency hedging can be used if this is a concern. However, currency-hedged funds tend to have higher ongoing management fees which eat more into returns. The impact of hedging, one way or another, is debatable.
Home Bias Has Been Decreasing Over Time
An interesting trend which you might notice is that home bias has been decreasing over time, at least in the case of the 4 developed economies previously mentioned. In all cases, the domestic overweighting percentages (red bars) have decreased.
This is most notable in the case of the United Kingdom. Over this 14 year time horizon, the UK market dropped from 10% to 7% of the global equity market. Domestic allocation dropped from 72% in 2001 to just 27% in 2015. This represents a drop in domestic overexposure (home bias) from 62% in 2001 to 20% in 2015. Vanguard attributes this home bias decrease to:
“A number of trends in the financial industry, including increased access to international investment vehicles, increased awareness of the value of international diversification, and lower costs”
Market Concentrations Lacks Diversification
One of the big dangers of home bias is market concentration. If you invest in an index fund which tracks your domestic market, you may think you are spreading your risk. But your domestic market might be less diversified than others.
I’m going to focus on 2 measures of concentration here. Sector concentration and security concentration (individual stocks/equities). In both cases, I will be using MSCI indices to represent the global market and 4 domestic markets. The MSCI ACWI IMI (All Country World Investable Market Index) covers large, mid and small cap stocks across 23 developed and 24 emerging markets. The 4 individual country IMI indices will represent the US, UK, Canadian and Australian markets.
Sector Concentration
Domestic Markets Vs The Global Market
The figure below represents how various domestic markets deviate from the global market, in terms of sector concentration. On the right hand side, you will see how the global market (MSCI ACWI IMI) is diversified by sector. IT at 19.16%, Financials at 16.6% etc.
The chart displays sector deviations, in 4 developed countries, from the glovbal market. In other words, it represents how concentrated some domestic markets are in various sectors, compared to the global market. The further the dots are from the centre line, the more that particular sector is underweight or overweight compared to the global market.

Countries Are concentrated in different sectors
Let’s take the UK, as an example. The IT sector in the UK is very small compared to the global market (-16.8%). On the other hand, the UK energy sector is relatively large compared to the global market (+9.21%). Therefore, if you were based in the UK and held 100% domestic equities, you would be more concentrated on energy and less concentrated on IT, in comparison to global stocks as a whole.
Compared to the global market, Canada and Australia are both biased towards the financial sector (+20.05% and +17.18% respectively) and biased away from the IT sector (-14.9% and -16.76% respectively).
The greater the size of the domestic market, the less deviation you will see overall, compared to the global market. The USA makes up around 55% of the global market. Therefore, the global market is more likely to match US market sector concentrations. And it does. The largest sector deviations are +6.22% (IT) and -3.2% (financials). All other sector deviations are within 3% of the global market.
What Effect Will Sector Concentration Have?
Quite simply, the more concentrated you are on a sector, the more a rally/downturn in that sector will affect your investments.
Security Concentration
It isn’t just sector concentration you have to take into account. Your domestic market might be heavily concentrated in only a few securities. The table below illustrates this phenomenon. The MSCI ACWI IMI (global stocks) index contains over 8800 securities. Importantly, the top 10 companies make up 9.81% of the index.

Compare that figure to some domestic markets. The United States has less securities and the top 10 account for 17.9% of the index. The index is more concentrated on the top 10. This pales in comparison to the UK, Canada and Australia. The top 10 companies in the UK account for 38.15% of the index. The top 10 in Canada account for 39.95% and the top 10 in Australia account for 47.19%. The Commercial Bank of Australia, the top security, accounts for 7.9% of the entire MSCI Australian IMI index.
What Effect Will Security Concentration Have?
The more concentrated you are in specific securities, the less diversified you are. The less diversified you are, the more your portfolio is prone to volatility.
Index Funds For Easy And Cheap Global Investing
Index funds or index ETFs allow you to track an index cheaply and easily. They offer significant advantages over actively managed mutual funds. In the UK, investing in a tax-efficient wrapper, such as a stocks and shares ISA, allows you to benefit from additional tax advantages. No capital gain taxes when selling, no taxes on dividends etc.
This combination makes global investing, from the UK, both easy and cheap.
Global Equity Index Investing Options
To reiterate, these are not recommendations, just examples.
Vanguard make global equity index investing very simple. There are really 3 approaches you can take to global investing through Vanguard.
The DIY Portfolio:
Take a Do-It-Yourself approach through Vanguard. Allocate your investments to individual index funds/ETFs in proportion to your preferences. Eg. 85% FTSE Global All-Cap index fund, 15% FTSE All Share index fund etc.
The advantage of this approach is that it gives you more control over your investments. The downside, in my opinion, is that it might turn you into your own active manager. You need to ask yourself why you are allocating certain percentages of your portfolio to certain regions.
Is the reason long-term diversification? Or are you allocating a larger percentage to one region because you are making a bet on that region? If the latter is true, you are now in the territory of expectations, which is a game many play but often lose.
An All-In-One Fund of Funds:
The Vanguard LifeStrategy Funds are basically an all-in-one portfolio of equities and bonds. Since I am focusing on global equities in this article, I will be looking at the LifeStrategy 100% Equity Fund.
I call it the ‘fund of funds’ because that’s exactly what it is. The LifeStrategy portfolio is made up of 10 index tracker funds, including the US Equity Index Fund and the Emerging Markets Stock Index Fund. This is designed to be the go-to fund that you place all your equity holdings in. It is diversified across sectors, countries and currencies.
The downside of this fund, in my opinion, is that home bias is integrated into the fund. The UK market currently makes up less than 6% of the global market (according to the MSCI ACWI IMI). But UK investments currently constitute around 25% of the Vanguard LifeStrategy Fund.
This quote, taken from an article in The Telegraph, from one of Vanguard’s own, Dr Peter Westaway explains the reasoning behind the LifeStrategy home bias.
“We think investors prefer to hold more in their home markets but we believe it’s of benefit in terms of diversification for investors to more closely reflect the global market weightings”
In other words, the justification is investor preference. Vanguard are aware that investors have a home bias but they have been taking active steps to reduce this. In 2014, they reduced UK-equities in the fund from 35% to 25%.
The All-In-One Global Index Fund/ETF:
This is another simple option. Global investing, without the home bias integrated into the LifeStrategy fund. Vanguard offer a market-cap weighted FTSE Global All Cap Index Fund which represents equities in 47 developed and emerging markets worldwide. Alternatively, an ETF is available, the FTSE All-World UCITS ETF, which tracks the FTSE All-World Index.
My preference is the index fund over the ETF for a few reasons.
Lower OCF: The ongoing charge is slightly lower for the index fund (0.24% vs 0.25%).
Small Cap Stocks: The Global All Cap index tracks nearly 8000 large, mid and small cap stocks. The FTSE All-World index, on the other hand tracks around 3200 large and mid cap stocks. The inclusion of small caps gives the All Cap, in my opinion, a slight diversification edge over the other.
Accumulation Over Income: The index fund is accumulating vs the ETF which distributes dividends as income. I am a big believer in dividend reinvestment for long-term wealth accumulation. The index fund automates this process.
Conclusion
How we allocate our investments is not all down to logic. There is even a whole subfield of economics associated with this phenomenon, behavioural finance.
In this article, I’ve hopefully pinpointed the reasons for investing home bias, addressed the pitfalls and provided some practical solutions.
If you liked this article, don’t forget to hit the like button down below. What is your opinion on investor home bias? Let me know in the comments section down below. I respond to every comment.
If you’re looking for resources to better your own personal finances, here are some of my recommendations:
Get 1 Free Share With FreeTrade - Sign up for free to the FreeTrade investing app and get 1 free share (up to £200 value) with my referral bonus.
Facebook - UK Passive Investing Group - Join A Like-Minded Community
Check out my offers page to earn some free money and grab some freebies.
Rich Dad, Poor Dad by Robert Kiyosaki
The Little Book of Common Sense Investing by John C Bogle
The Intelligent Investor by Benjamin Graham


The best UK free share referral offers, updated throughout August 2026. Get free stocks and shares with Shares App, FreeTrade, Stake and more.